
Road safety is a major concern for cities and transportation agencies. While the number of crashes is often discussed, the severity of those crashes (meaning how serious the injuries) are or is equally important. In this blog post, we explore how the time of day affects how severe a crash might be, and what we can do to make roads safer, especially for vulnerable road users like pedestrians and cyclists.
What Was the Research Question?
The main question we set out to answer was:
“How does the time of day influence the severity of vehicle crashes in the U.S., and what can be done to improve safety based on these patterns?”
To explore this, we used traffic crash data to look at the average number of injuries per crash during different parts of the day.
Why Focus on Time of Day?
The time of day plays a big role in road safety. Think about it—driving conditions change depending on whether it’s daylight or dark, whether the roads are busy with morning commuters or almost empty at night.
Some key factors that vary by time of day include:
- Visibility – It’s easier to see during the day than at night.
- Driver alertness – People are often more tired late at night.
- Traffic volume – There are more cars on the road during rush hours.
Understanding how these factors relate to crash severity can help transportation agencies make smart decisions to reduce injuries and save lives.
How Did We Analyze the Data?
We grouped crash times into four categories:
- Late Night (12AM–5AM)
- Morning (6AM–11AM)
- Afternoon (12PM–5PM)
- Evening (6PM–11PM)
Then we calculated the average number of injuries per crash in each time period and used a bar chart to display the results.
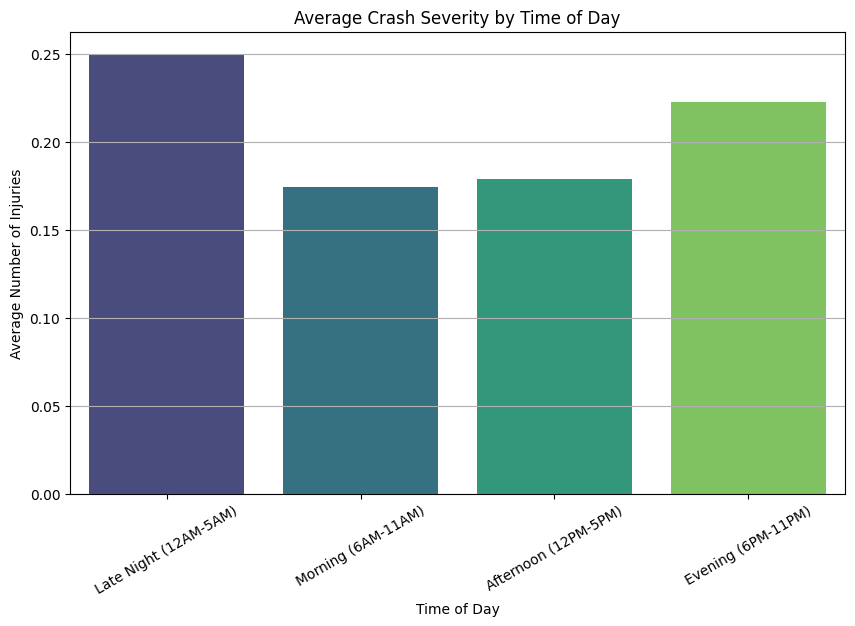
Key Findings
1. Late Night Crashes Are the Most Severe
Crashes that happen between midnight and 5 AM lead to the highest average number of injuries. This is likely because:
- Drivers may be drowsy, impaired by alcohol, or simply not as alert.
- Visibility is lowest, especially on roads without good street lighting.
- There is less traffic enforcement or fewer witnesses around to prevent reckless driving.
2. Evening Crashes Also Have High Severity
The evening period (6PM–11PM) showed the second-highest severity. Fatigue can begin to set in after a long day, and darkness starts to affect visibility. It’s also a time when many people are on the road—commuting, running errands, or heading home from social events.
3. Morning and Afternoon Are Less Severe
Crash severity is lower in the morning (6AM–11AM) and afternoon (12PM–5PM). These hours benefit from:
- Better visibility due to daylight.
- Drivers being more alert, especially in the morning.
- Higher road usage, which can lead to slower, more cautious driving.
Why This Matters
It’s not just about how many crashes happen—it’s about how dangerous those crashes are. A single crash with severe injuries is far more impactful than multiple minor ones.
By understanding when severe crashes happen, transportation leaders can focus their efforts and resources more effectively.
Recommendations for Safer Roads
Based on the data, here are four key recommendations we would share with the U.S. Department of Transportation (DOT) and the Federal Highway Administration (FHWA):
1. Increase Late-Night Patrols and Enforcement
More police presence and stricter enforcement of speed and DUI laws between midnight and 5 AM can help reduce risky behavior.
2. Enhance Nighttime Infrastructure for Pedestrians and Cyclists
- Install more street lighting, especially in dark or rural areas.
- Use reflective road signs and lit crosswalks.
- Add speed bumps and other traffic calming measures in places with heavy pedestrian traffic.
3. Run Targeted Public Safety Campaigns
Create educational campaigns to raise awareness about:
- Drowsy driving
- Nighttime visibility
- Safe driving after social events These messages can be especially targeted to young drivers, shift workers, and delivery personnel.
4. Adopt Smart Road Technology
- Use smart lighting systems that adjust based on traffic flow.
- Install sensors at high-risk intersections to monitor and alert drivers.
- Consider connected vehicle technology that warns drivers of upcoming hazards or sharp turns, especially at night.
Questions We Couldn’t Answer
Even though the data helped uncover patterns, we couldn’t explore everything. Some questions that remain:
- What were the causes of the most severe crashes (e.g., alcohol, distraction)?
- Were pedestrians or cyclists more affected during certain times?
- How does the type of road (urban vs. rural) influence severity by time of day?
These questions need more detailed crash data, especially with info about the type of road user and the behavior of drivers.
Sources
- Chicago Police Department – Traffic Crashes (Crash Data Source)
- Federal Highway Administration (2023). Highway Safety Improvement Program Manual.
- National Highway Traffic Safety Administration (NHTSA). Traffic Safety Facts Annual Report.
- Seaborn & Pandas Libraries for Python Data Visualization
 Certification")
")
