
This interactive Power BI dashboard was developed to provide a clear, data-driven view of the U.S. healthcare landscape. Designed for stakeholders ranging from hospital administrators to policy analysts, the dashboard focuses on patient trends, healthcare costs, and treatment outcomes across multiple dimensions.
Key features include:
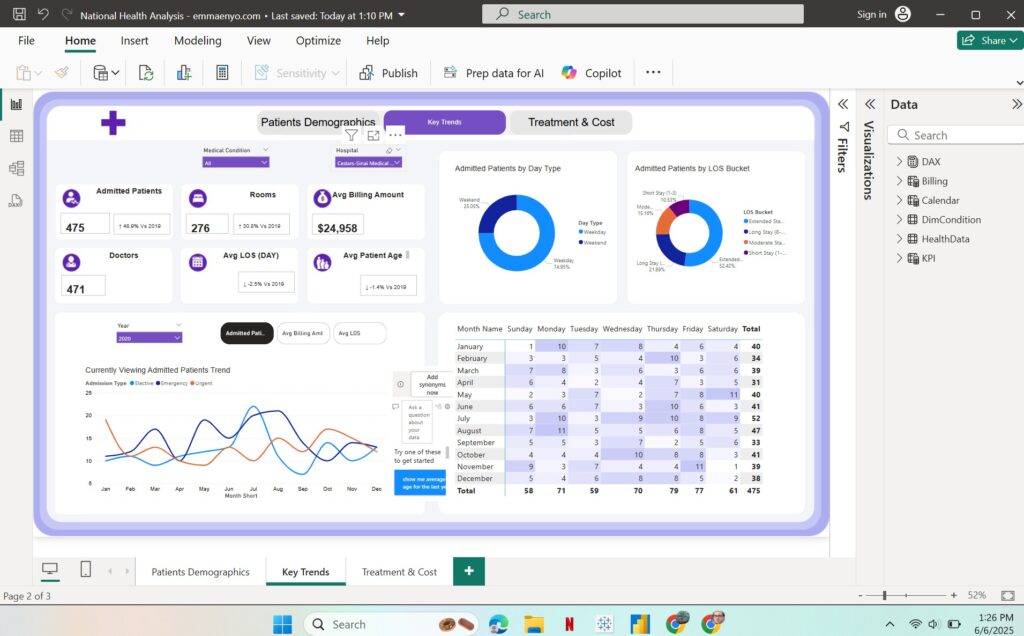
✅ Core Health Metrics
Track year-over-year changes in patient admissions, doctor availability, bed capacity, billing totals, length of stay, and demographic breakdowns.
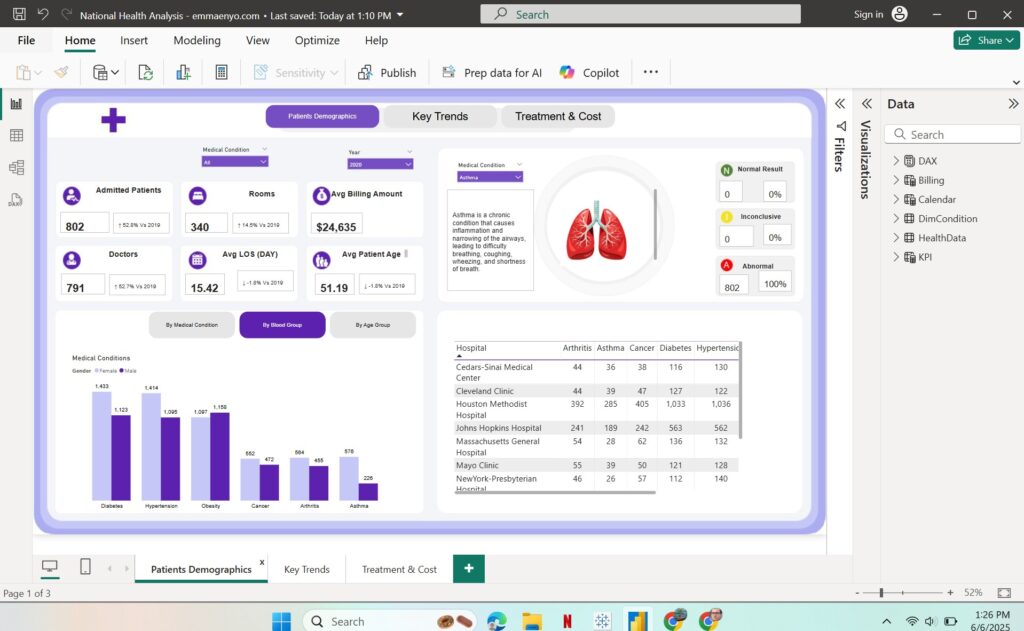
✅ Patient Segmentation
Visualize population distribution by gender and age group, helping to uncover patterns in patient needs and outcomes.
✅ Condition-Specific Analysis
Explore deep dives into conditions like Asthma, with metrics on test results, treatments, and patient outcomes presented in accessible visual formats.
✅ Hospital-Level Trends
Compare performance across major U.S. hospitals, including patient volumes, procedure types, and regional disparities.
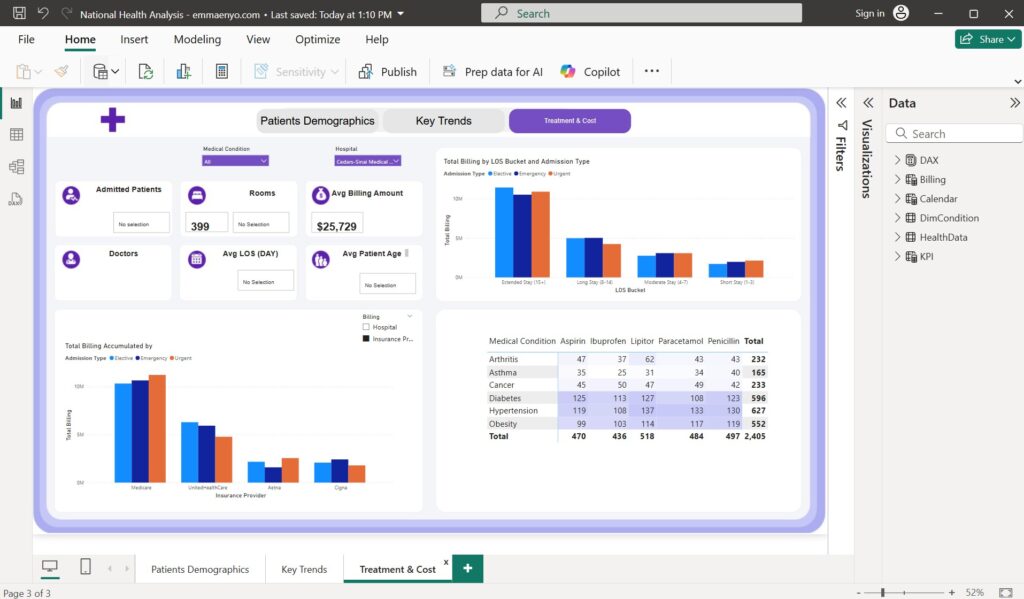
✅ Financial & Operational Insights
Analyze healthcare spending by hospital and insurance provider, with trends in revenue, cost per patient, and resource utilization.
With its clean visual layout, filterable views, and intuitive navigation, this dashboard supports better resource planning, policy development, and patient care optimization. It’s a strong example of how thoughtful data visualization can turn complex health data into actionable insight.


